Unlocking Business Insights with a Sales Dashboard in Excel
Creating a sales dashboard in Excel is a powerful way to visualize your sales data, track performance, and make data-driven decisions. This guide explores the essential steps and best practices to build an effective sales dashboard that provides real-time insights and enhances strategic planning.
Designing an Effective Sales Dashboard in Excel
Constructing a comprehensive sales dashboard begins with understanding your key performance indicators (KPIs), such as total sales, sales growth, average deal size, and customer acquisition rates. Excel offers a versatile platform that allows you to organize data efficiently and incorporate dynamic visual elements like charts, sparklines, and pivot tables. To craft an impactful dashboard:
- Gather and organize data: Ensure your sales data is clean, consistent, and updated regularly. Use structured tables for easy referencing.
- Identify KPIs: Focus on metrics that reflect your business goals, such as monthly sales targets, regional performance, or product-specific sales.
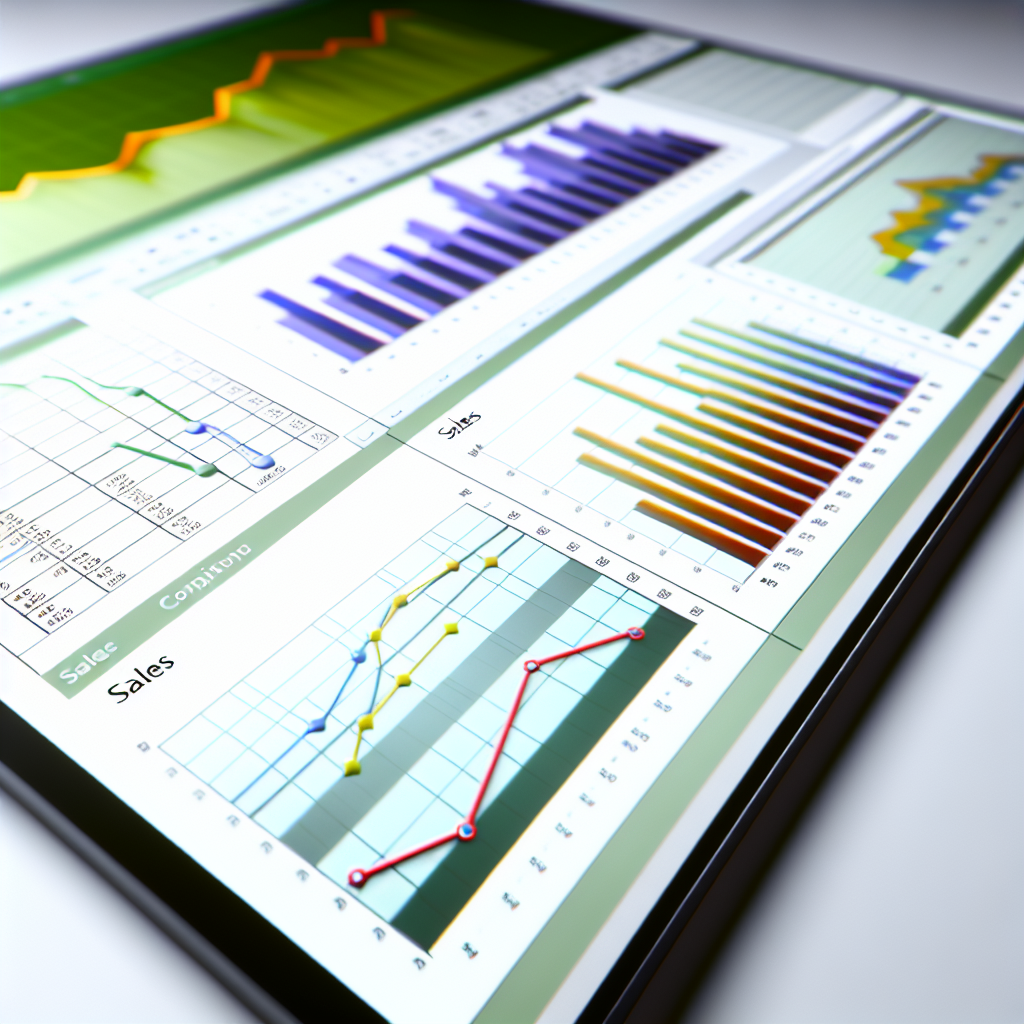
- Create visual components: Use bar charts, pie charts, and line graphs to represent trends clearly. Incorporate slicers and filters to allow interactive data exploration.
Advanced users can utilize Excel’s Power Query and Power Pivot features to manage large datasets more effectively, automate data refreshes, and perform complex calculations, thus ensuring your dashboard remains accurate and dynamic.
Maintaining and Enhancing Your Sales Dashboard
A sales dashboard is most valuable when it stays relevant and insightful over time. Regular maintenance involves verifying data accuracy, updating KPIs, and refining visualizations based on stakeholder feedback. To enhance your dashboard’s effectiveness:
- Automate data updates: Connect your dashboard to live data sources or set up automatic refreshes to avoid manual updates.
- Customize for different audiences: Create multiple views tailored for sales managers, executives, or marketing teams to focus on their specific needs.
- Implement drill-down capabilities: Enable users to click on elements for detailed analysis, helping identify root causes of trends or issues.
Leveraging Excel’s versatility ensures your sales dashboard adapts to changing business environments, fostering informed decision-making that can boost overall sales performance and strategic growth.
Conclusion
Building a sales dashboard in Excel combines data organization, visualization, and automation to deliver powerful insights into your sales processes. By focusing on key KPIs, designing interactive elements, and maintaining your dashboard regularly, you can enhance your decision-making capabilities. Whether you’re a beginner or an advanced user, Excel provides the tools needed to create a compelling sales performance tracker that drives results.